W04 Activity: Integration Testing Tools and Techniques
Overview
Testers use many tools and techniques when doing white box testing to understand what's really going on in the system. Sometimes the developers are expecting the system to do one thing, but it actually does another. Testers can help diagnose problems by inspecting the payload returned by a call to a service and determining if the expected result matches the actual result. This is the heart of integration testing.
In many organizations, integration tests are handled automatically by developers. It is possible to create drivers and stubs that mimic calls to web services or responses from web services. A tester can manually drive a call to a web service endpoint using a tool like Postman. Then the response can be observed and evaluated. Most modern browsers also contain developer tools that allow you to do a similar inspection. In this page you will learn how to use both tools to test endpoints.
Installing and Using Postman
Postman is a tool that is widely used by testers and developers alike to exercise web-based service endpoints. You will install the Postman tool on your computer by navigating to the Postman web site and downloading and installing the application. Follow the link below to begin.
https://www.postman.com/downloads/
Follow the prompts for installing the tool on your system. When Postman first starts, you may be asked to create an account. Although creating an account is not necessary for this test, it will be necessary in future tests, so go ahead and create an account now.
When you first start Postman, you will see a screen similar to this one below.
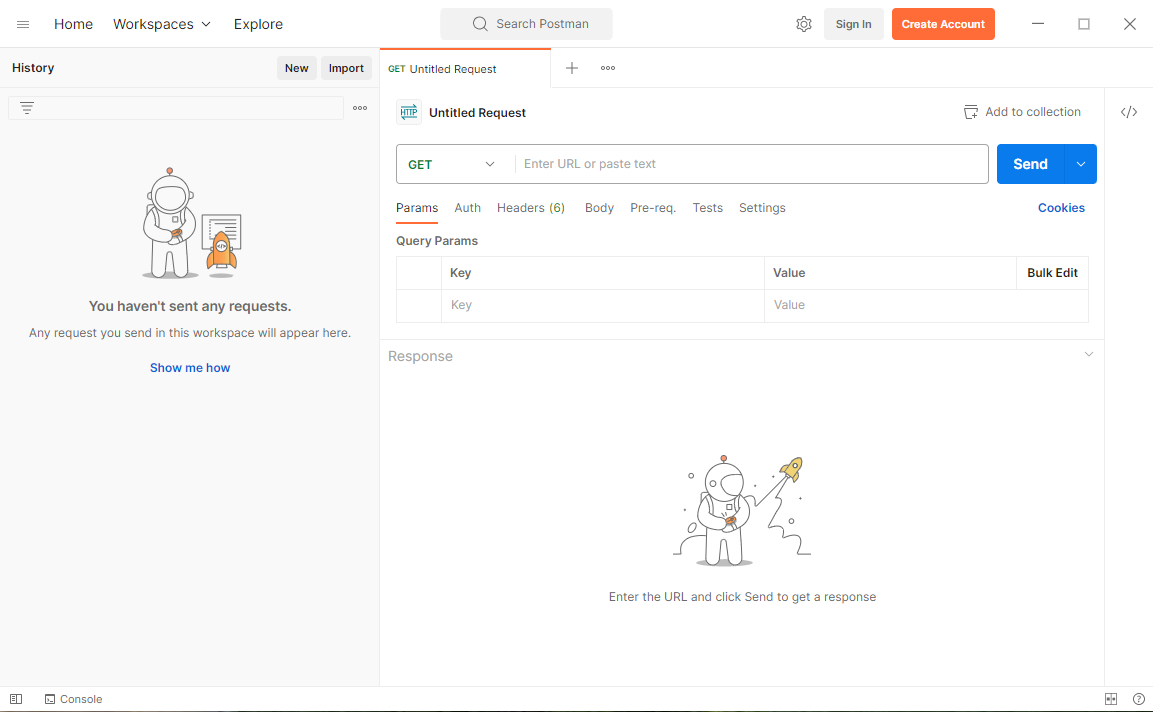
You can create an HTTP request by typing the URL into the box that reads "Enter URL or paste text".
For this example, we will use the API call to OpenWeather.
The documentation for this API is found here: https://openweathermap.org/current
Reading the documentation we see that the URL is as follows:
https://api.openweathermap.org/data/2.5/weather
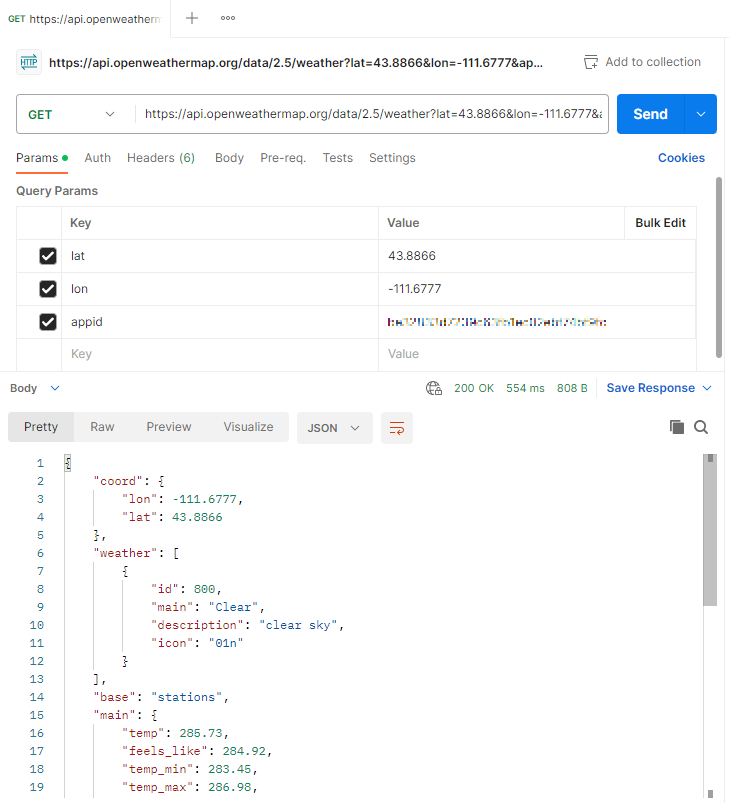
The API for current weather also requires a few query params. We will add the lat, lon, and appid to the query params section in Postman as shown.
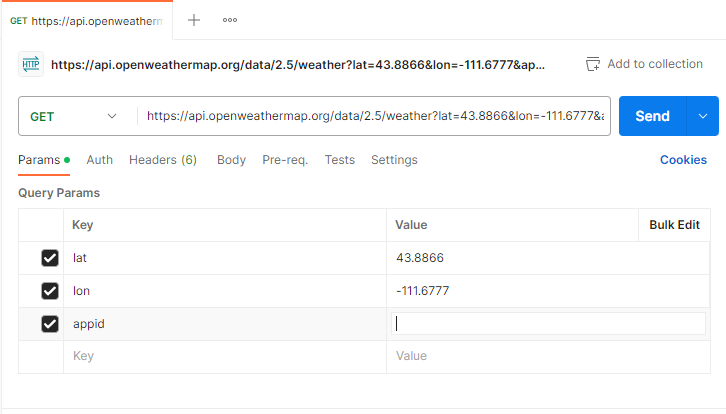
Let's leave the appid blank for now, and click the Send button. Let's inspect the result.
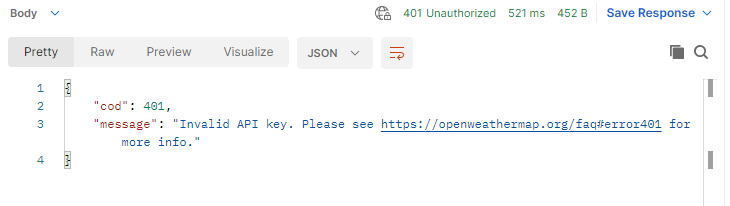
The services responded with an HTTP 401 Unauthorized response. In the body of the response was a JSON object with two items - cod and message. The message informs us that our API key was invalid. So much for testing with an empty appid!
Under normal circumstances, the production application API keys are not shared with testers, so we will have to create our own!
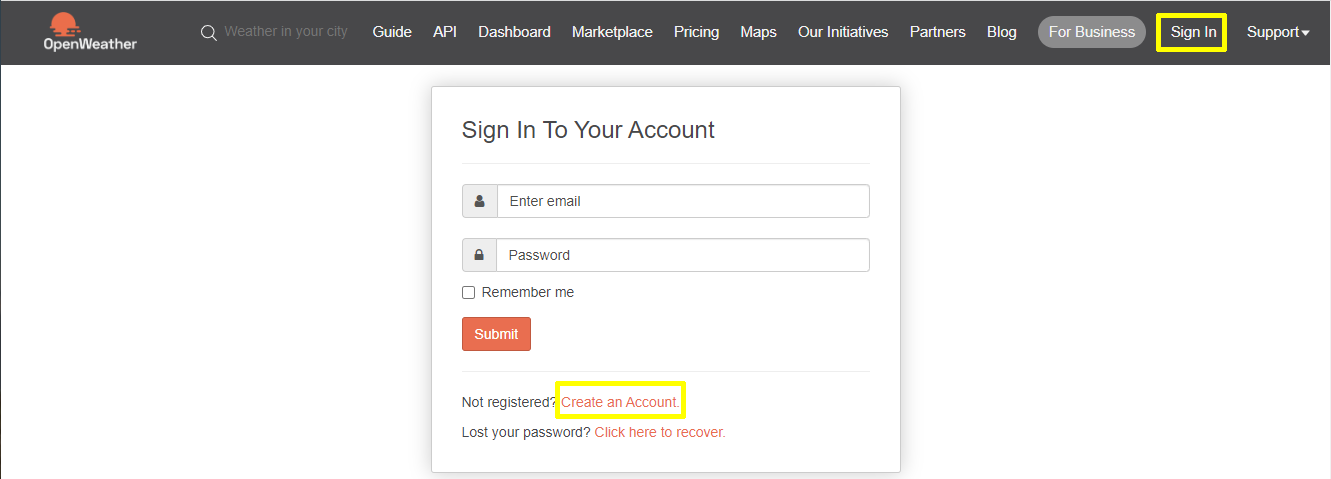
Browse to https://home.openweathermap.org/users/sign_in and click the "Create an account" button. Go through the registration process to create your free account.
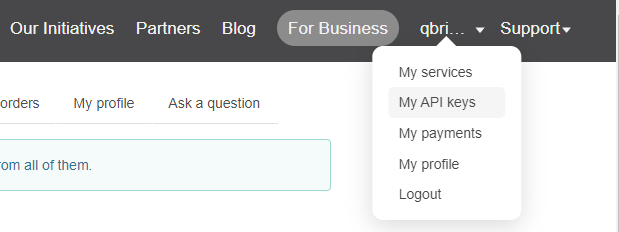
Once you are registered and logged in, click on your user name and choose "My API keys" from the menu.
In the Create Key section, give your API key the name "testing" and click Generate.
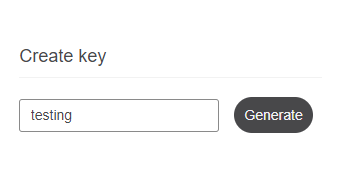
On your right you will see the newly generated API key for testing which you can copy.
Typically API keys for OpenWeather take about 20-30 minutes to become active. You may have to be patient before the next part of this works properly.
Copy this key and paste it into the appid value and press Send again. This time you will get a more complete response, including a JSON payload which you can inspect below. You can also see that the HTTP response code this time was 200 OK.
Although we won't use them in today's example, Postman allows you to configure all the details about your HTTP request, including Authorization Headers, HTTP Headers, Request Body and other things that are beyond the scope of this class to explain. This makes Postman a powerful tool for integration testing.
If you are working through the local test environment setup you can return to it now with your API key.
Using Browser Developer Tools (Chrome edition)
Many modern browsers are based on the Chromium web rendering engine and come with a useful set of tools for inspecting HTTP calls that are made by a web site. This comes in handy for us when we are inspecting our web page interactions with the back end servers.
If you haven't already, start the Django application server and start your local copy of the Teton Idaho Chamber of Commerce Web Site by selecting the index.html file and clicking the "Go Live" button as explained in W04 Activity: Setup a Local Test Environment.
Now click on the link to browse to the Directory page of the website.
If you are using the Chrome browser, press Ctrl-Shift-I on Windows or Command-Shift-I on Mac to open. This will open a developer tools window similar to the screenshot below.
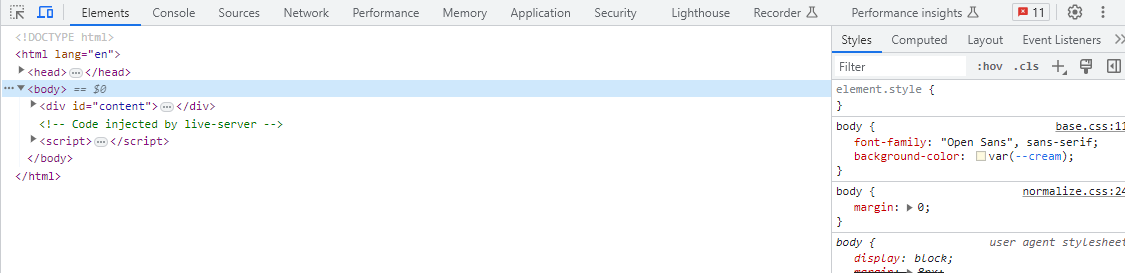 Chrome Dev Tools
From this toolbox we can get information about the HTTP calls the browser is making in response to information in the web page. To do this, click on the Network tab, then press Ctrl-R or Command-R to reload the page. This will show you all of the web calls made by the page to gather information, including our call to the Directory Data Service represented by the "all" URL.
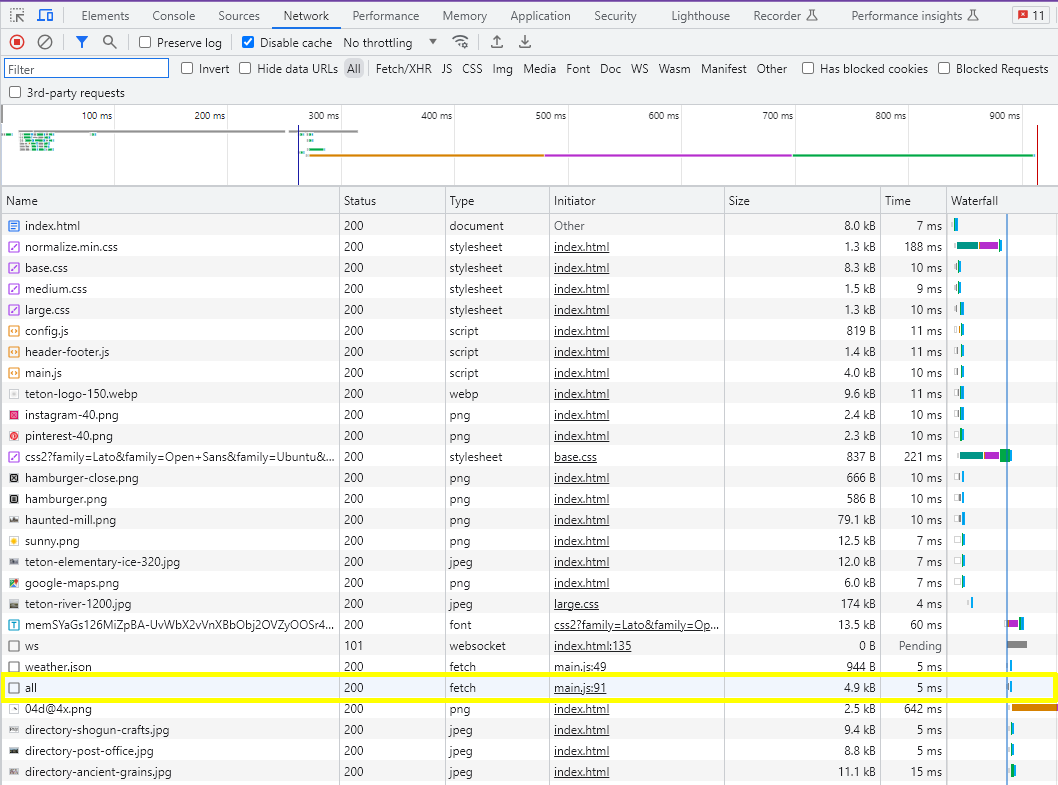
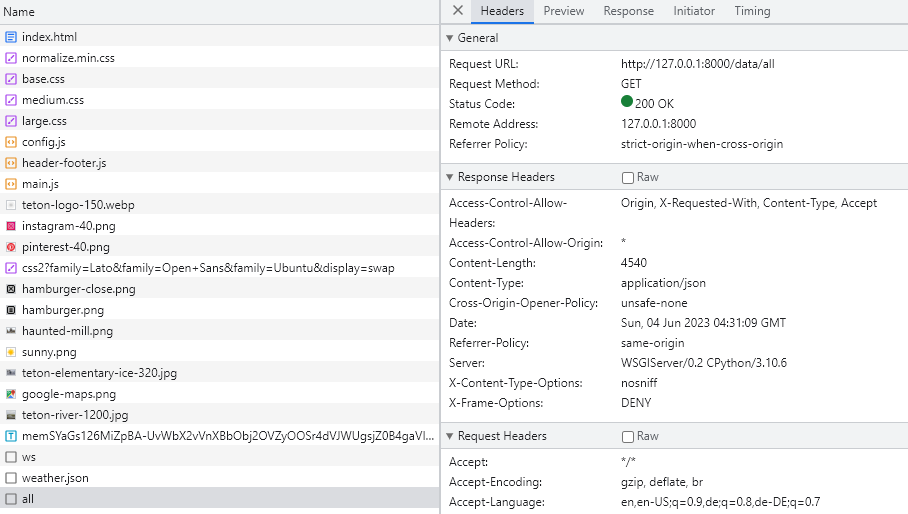
When you click on the "all" URL, this opens an information box to the right with several tabs. By default, the Headers tab is shown which displays useful information about the HTTP Request and HTTP Response. Again, explaining everything here is beyond the scope of this class, but it's helpful to know where this information is if a developer asks you for it. Notice the HTTP status code 200 OK appears here.
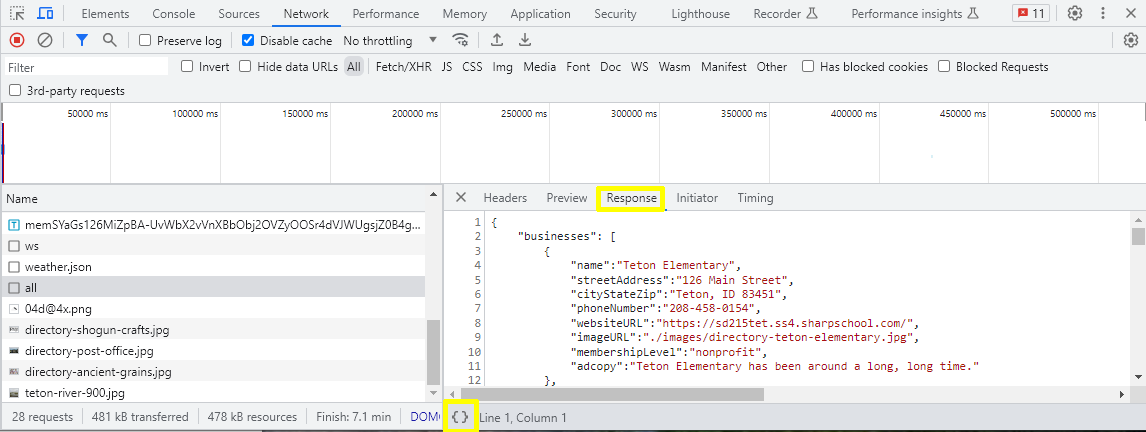
If we want to see the payload of the response from the server, we click on the "Response" tab. Sometimes the response comes back in a format that is not easily human-readable. Clicking the curly braces below { } can sometimes help by formatting the response. We can now inspect the response from the server to determine if everything looks as expected.
Conclusion
You now have been shown two different ways to get information from an API. You will notice that the main difference between the Chrome Developer Tools and the Postman Tool is flexibility. Chrome will only show you what the web site is programmed to do. Postman allows you to create your own requests to see what the outcome is. On the other hand, Chrome shows you what's really going on with the system under test so it's useful for troubleshooting actual requests from the web page.
Useful Links:
- Return to: Week Overview | Course Home | Canvas