UX: Page Performance
Overview
As a web developer, creating beautiful, standards-based pages is just the beginning. To be effective, your site must also perform well and offer a great user experience (UX).
This learning activity introduces the key questions and metrics you should consider as you design your site to optimize for better performance. Focusing on this performance data will equip you to enhance the overall user experience and engagement.
Prepare
When users visit a page, their experience can be broken down into four core questions:
- Is it happening?
- Did the navigation start successfully? Has the server responded?
- At this stage, users want to know something is happening. They have clicked a link and landed on the page and want to see that it is responding. A delay here can feel like the site is broken.
- Is it useful?
- Has enough content rendered that users can see and engage with the content?
- Moving beyond simply knowing that the page has started loaded, users want to be able to see meaningful content quickly. If they can't, they may get frustrated and leave the page.
- Is it usable?
- Can users interact with the page, or is it still busy or unresponsive?
- If the page has visually loaded, it might look ready, but if buttons don't work or the page freezes, it's not usable.
- Is it delightful?
- Are interactions smooth and natural and free of lag?
- This stage is about polish. Smooth animations and responsive interactions make the experience feel high-quality and enjoyable. Whereas if content is jumping around or contains lag, it can feel unprofessional.
Performance Metrics
To answer the above questions in a measurable way, web developers use web performance metrics. Here are three core metrics:
- First Contentful Paint (FCP)
- What it is: Time from page load to when any content first appears (including text or images).
- Why it matters: Gives the user confidence that something is happening.
- Largest Contentful Paint (LCP)
- What it is: Time until the largest visible content element (usually an image or a big text block) appears.
- Why it matters: Helps determine when the main content is visible and usable.
- Cumulative Layout Shift (CLS)
- What it is: A score that represents how much the layout unexpectedly shifts while loading.
- Why it matters: Shifts can cause users to click the wrong thing or feel disoriented.
There are additional metrics that are important to consider if you want to dig deeper into this field, such as interaction latency, runtime responsiveness, smoothness, total blocking time, and time to first byte. These metrics may also be useful in seeking to evaluate and improve page performance.
User Perception
In addition to the metrics above, it is important to consider the perception of the user as well. A fast page that feels awkward can still create frustration, and a slightly slower page that feels smooth might result in a better experience. With this in mind, it is important consider both:
- The objective data (such as the metrics mentioned above)
- The subjective experience (smoothness, flow, and user feedback).
The following are some tips to improve the overall user experience and performance.
- Use lazy loading for images below the fold.
- Minimize JavaScript and CSS blocking the main thread.
- Use efficient caching and content delivery networks CDNs.
- Avoid unexpected layout changes by setting size attributes on images and embeds.
- Test on a variety of real devices and network conditions.
Lighthouse Tools
Throughout this course and previous courses, you have used the Google Lighthouse tool, that is integrated into DevTools. This tool generates reports on performance metrics, as well as accessibility, best practices, and Search Engine Optimization (SEO). You have already been running this tool and it is used in many of the assignment rubrics.
Another comparable tool that is geared towards analyzing the performance of live web pages and providing optimization suggestions is the online PageSpeed Insights application on web.dev.
The following are some of the principles and specific diagnostic methods you have been using throughout this and previous courses to consider performance:
- Optimize images, properly size images, and consider next generation image formats
- Set an explicit width and height on image elements to reduce layout shifts and improve CLS.
- Defer offscreen images and content including using lazy loading and other methods.
- Use a Content Delivery Network (CDN)
- Avoid excessive DOM sizes
- Reduce unused CSS and unused JavaScript.
- Reduce the scope and complexity of style calculations
Activity Instructions
In this activity you will evaluate the performance of The Church's website using the Lighthouse tools.
- In your browser, start an incognito window or private browsing session.
- Navigate to the old Church url of:
https://lds.org. Why does this URL redirect to a new domain?Note the domain name forwarding service changes the URL to
https://churchofjesuschrist.org.
(In addition, your preferred language parameter may be part of the URL's querystring with a name-value pair, e.g.,?lang=es) - How long did the page take to render the actionable
Sign Inbutton from your end-user perspective? - Open the browser's DevTools on this page to check the performance using metrics.
- Run a audit on the page by using the Performance tab and clicking the reload
button.
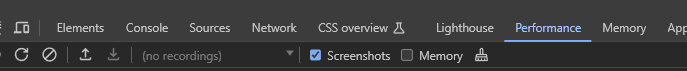
Screenshot of Performance Tab 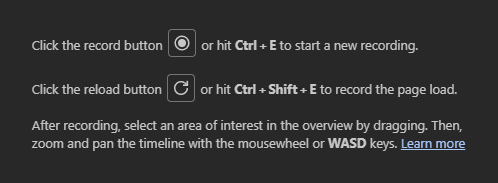
Screenshot of Performance Audit Reload Button - Use the screenshot timeline to find out how long it took to finally render the
Sign Inbutton. You can do this visually.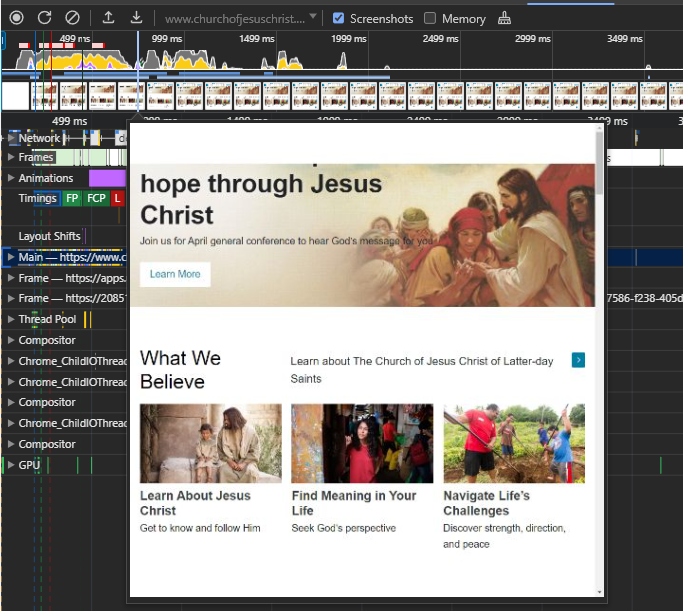
Screenshot of Timeline Paint - Using the Lighthouse tool, select the Mobile device and turn on the Performance category and then click Analyze page load.
- Review the Performance metrics and the diagnostics.
Is there anything that you might suggest as low hanging fruit to have fixed? - Post a comment or respond to a post in Microsoft Teams.
- Evaluate your own work for page load using these page performance tools.
Optional Resources
- Web Performance Working Group
"The mission of the Web Performance Working Group is to provide methods to measure aspects of application performance of user agent features and APIs."