Debugging is the process of finding and fixing errors in your code. This is an essential
skill for any developer. In this activity, you will learn how to use the browser's DevTools to debug your
JavaScript
code.
Prepare
Types of Errors
There are three types of errors that you will encounter when writing JavaScript code:
Syntax Errors – These errors occur when you write code that does not follow
the rules of the JavaScript language. These errors are caught by the browser and will prevent your code from
running.
Runtime Errors – These errors occur while your code is running. They
can be caused by a variety of issues, such as trying to access a property of an object that does not exist or
calling a function that does not exist.
Logical Errors – These errors occur when your code does not produce the
expected result. These errors can be difficult to find because they do not cause the browser to throw an error.
Activity Instructions
This activity focuses on debugging techniques for the browser.
Setup Files
In your week02 subfolder, add a file named "debugging.html".
In the debugging.html file, type ! and then press the tab key on
your keyboard. This action will automatically add the basic components of an HTML document.
Add a subfolder named "scripts" to the week02 folder, and add a file named
"debugging.js".
In debugging.html file, add a script reference to the
debugging.js JavaScript file.
Check Your Understanding
Using Live/Five Server, open your debugging.html file in a browser.
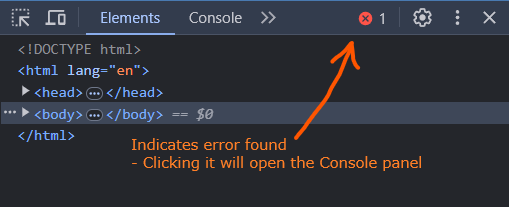
Open the browser's DevTools and open the Console tab.
DevTools Console
Note any errors highlighted in red in the DevTools Console tab and outlined in the Console window. These are
syntax or runtime
errors. These errors will stop your code from running until they are fixed.
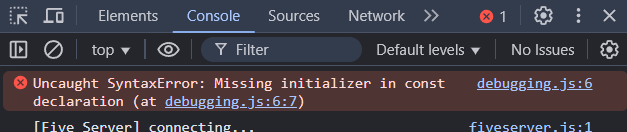
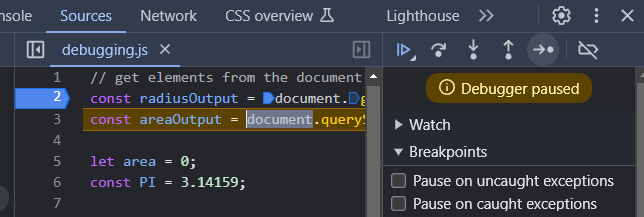
Fix the first error identified in the debugging.js file. The image below indicates that the
error is on line 6 (debugging.js:6).
The comparison operator == is confusing the compiler. In VS Code, remove the extra equal sign.
const PI = 3.14159;
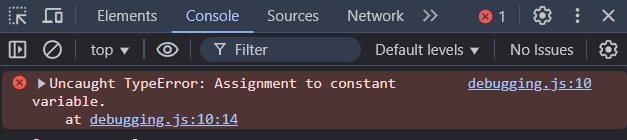
In your localhost browser session, refresh the page and check the console for the next error.
This error refers to the issue of trying to assign a value to an HTML element reference. This might be confusing
given the error message says "Assignment to constant variable". Change the lines of code for both elements to
use
the textContent property.
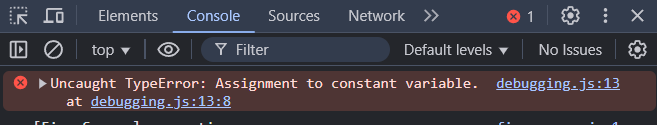
In your localhost browser session, refresh the page and check the console for the next error.
This error message is accurate. The code is attempting to assign a new value to the radius
variable, which was declared as a constant. Change the variable declaration from const to
let.
let radius = 10;
Fix any other errors found in the console.
After you get output to the page that appears correct, open the Sources panel in DevTools.
Practice "step debugging" through the JavaScript code by setting a breakpoint—click on the line number
where you want to pause program execution.
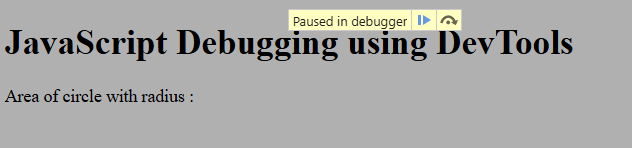
Refresh the page to trigger the code to run again. The page will be grayed out and display the message
"Paused in debugger".
Use the Step →• button to move through the code line by line.
At any time, you can hover your mouse over a variable to view its current value.
Continue to step through the code until you have a good understanding of how the code is executing.