Activity: Data Gathering
- Purpose:
- Learn the different types of databases and their uses.
- Learn how to gather data.
- Task: Gather three days worth of useful data on three different topics.
Instructions
- Read the following case study:
Case Study
Data is all around us and can be gathered in a variety of ways.
You will be using the sheets at Data Gathering Activities Worksheet to gather your own data this week.
The data gathering will be very informal. You will take the sheet you find on the pdf file and print them out. Some data gathering will take 3 days for you to collect. Then you will record that data you gathered on each sheet.
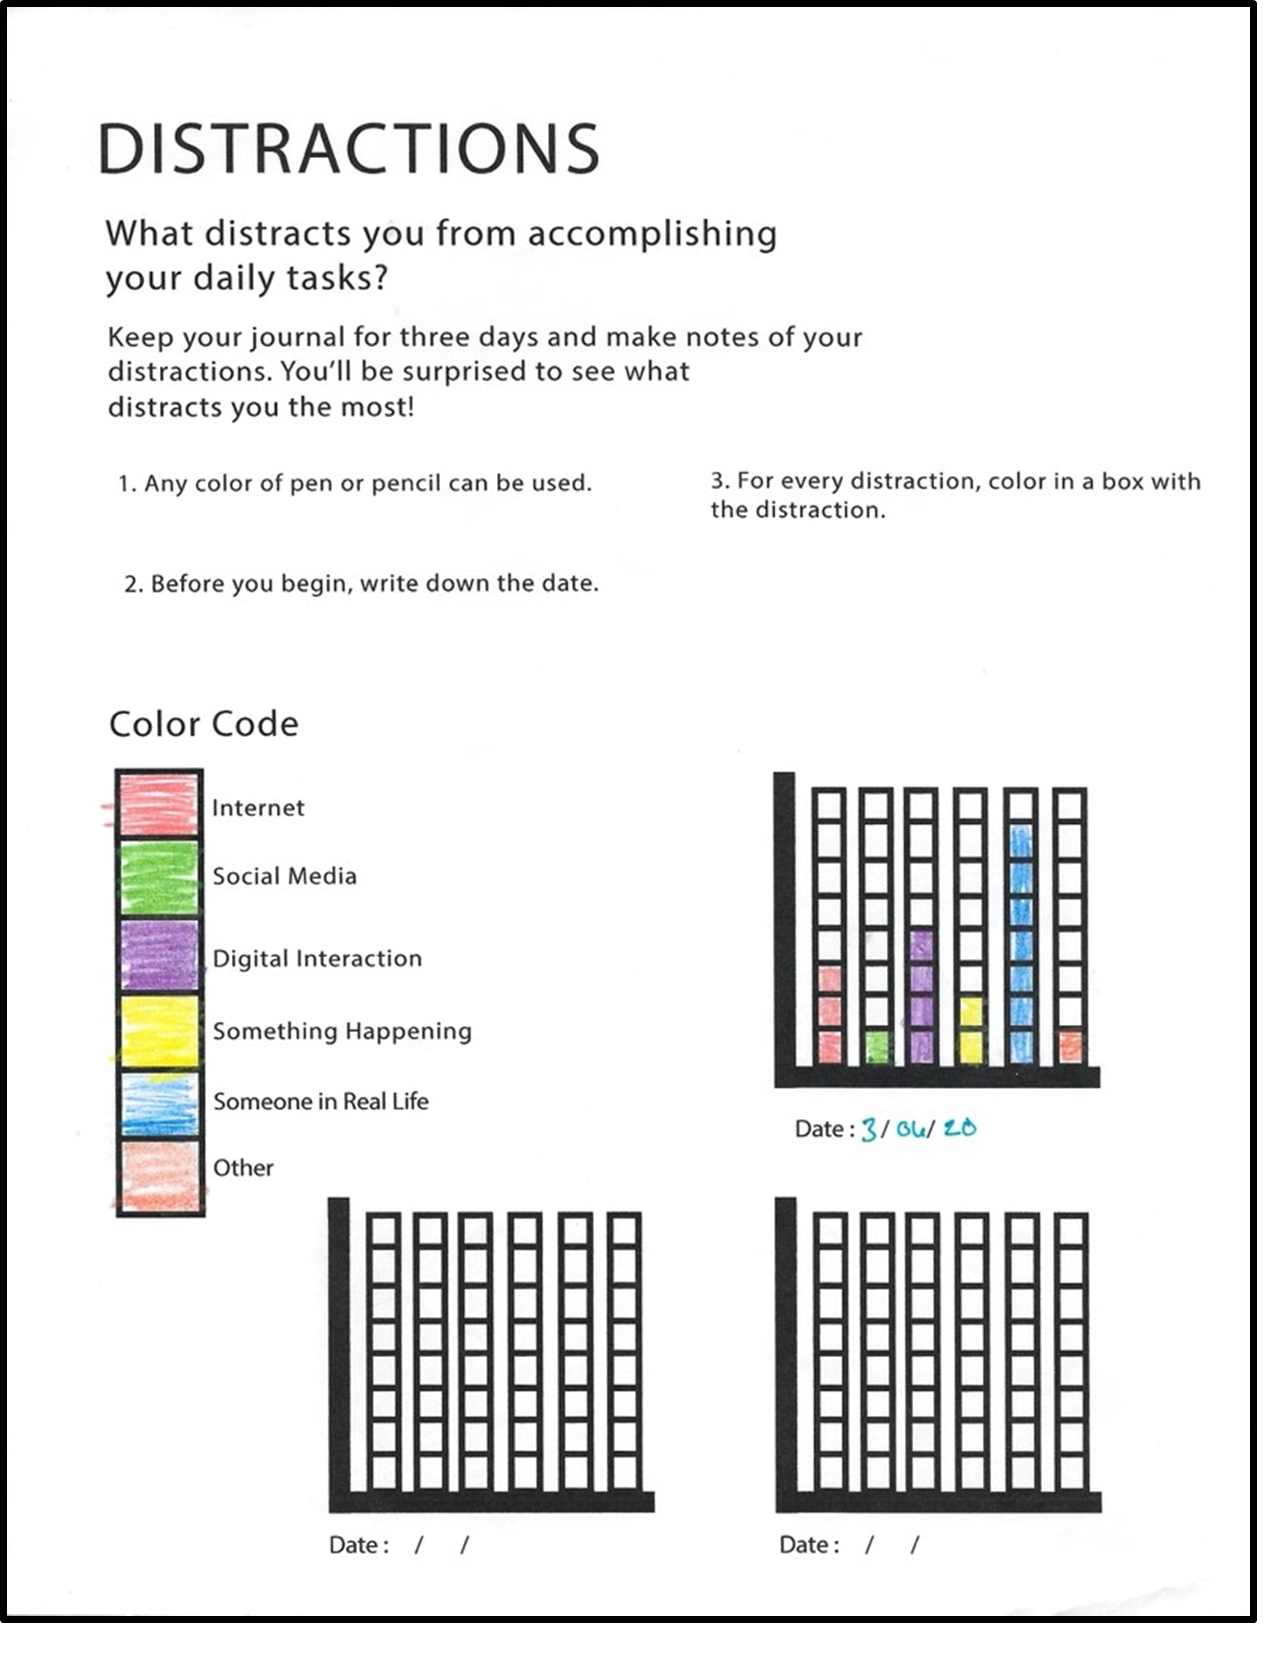
The first sheet is to gather data on what distracts you. You will fill in a color with colored pencils, markers or crayons on the Color Code key for each category of distraction. Then for each day you will fill in a small square of that color each time you are distracted in that category. You will do this for 3 days. Here is an example with just the first day filled out:
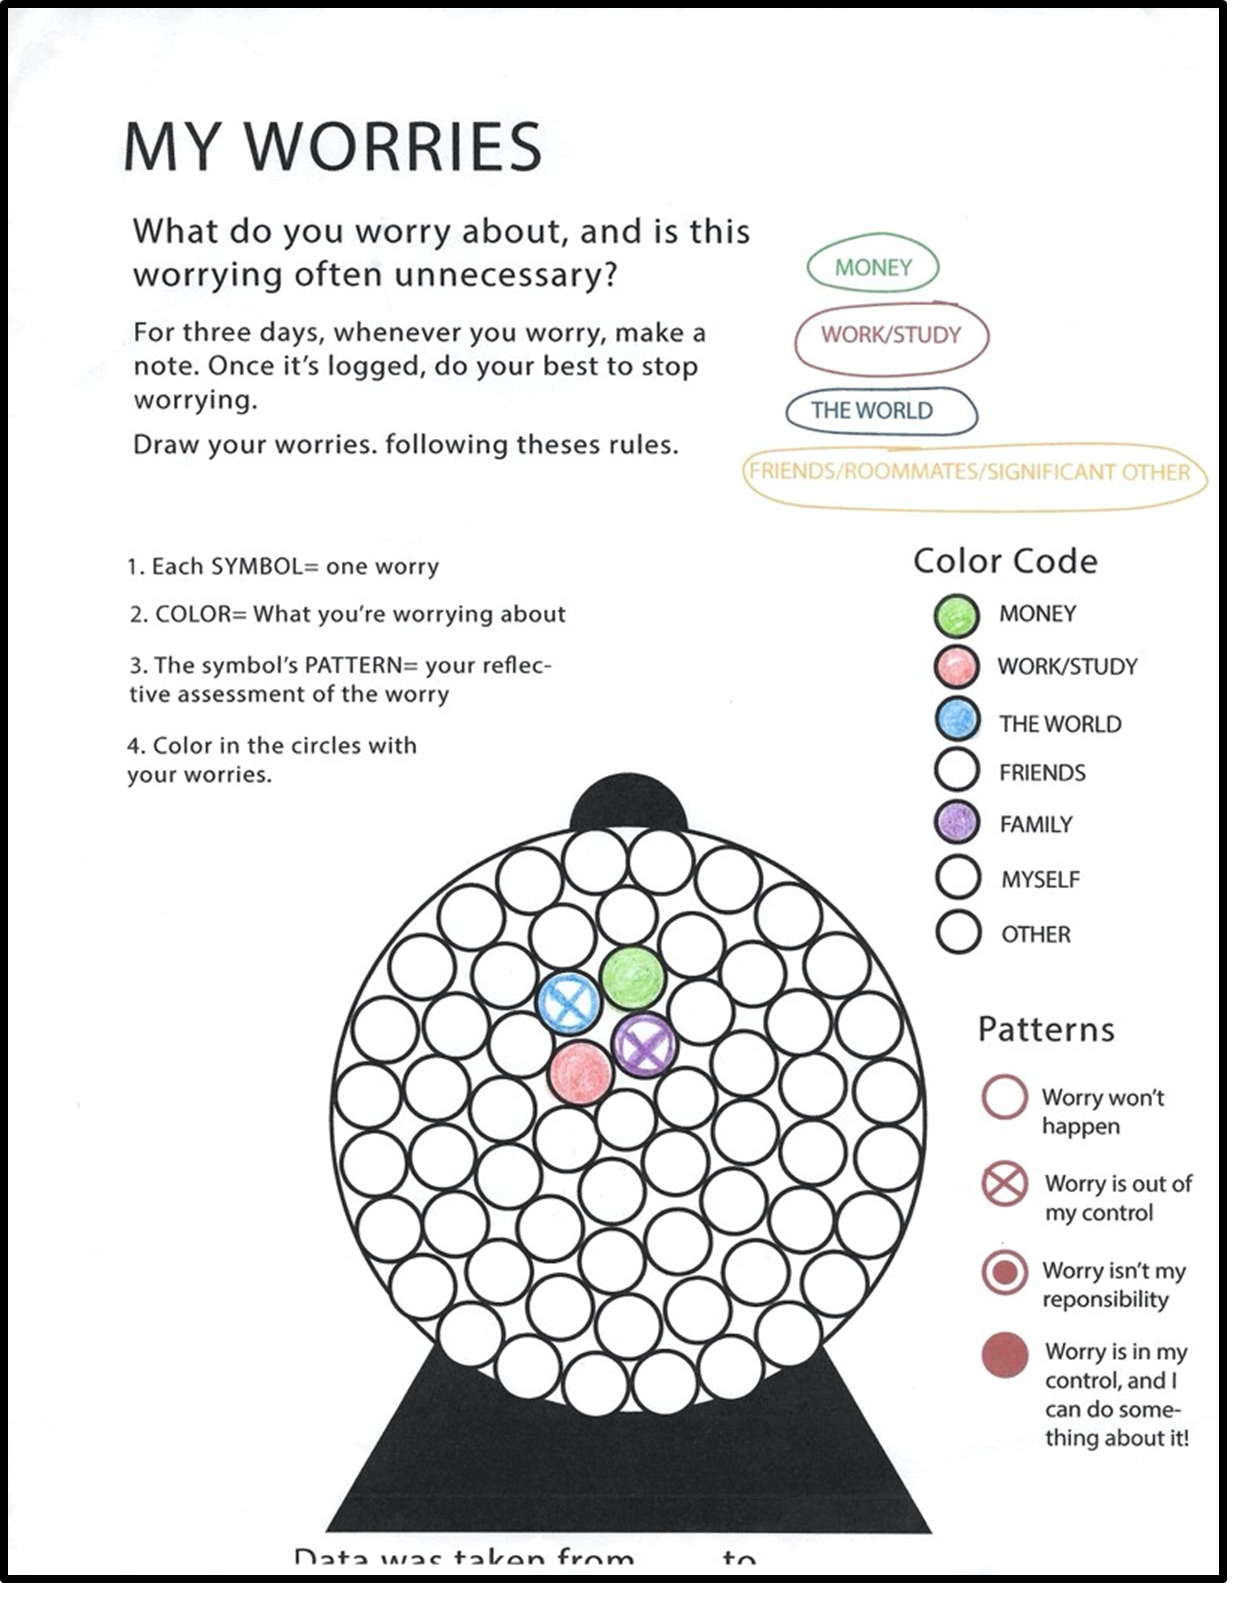
The second sheet is gathering information about what worries you. You don't necessarily need to keep track of your worries for 3 days. You may already know what worries you, or you can just keep track of different times you worry for those 3 days. It's up to you. Fill in the Color Code key with a color for each category you worry about. In addition to the color for each worry you are going to take this a step further and decide if that particular worry is something that won't happen, or if that worry is out of your control, or isn't your responsibility or if it is in your control and you can do something about it. These categories are represented by a pattern that you will use to fill in the gumballs. So, each worry will not only have a color but a pattern as well. Each worry is represented as one gumball. You do not need to fill in every gumball. Hopefully you don't have that many worries. Here is an example:
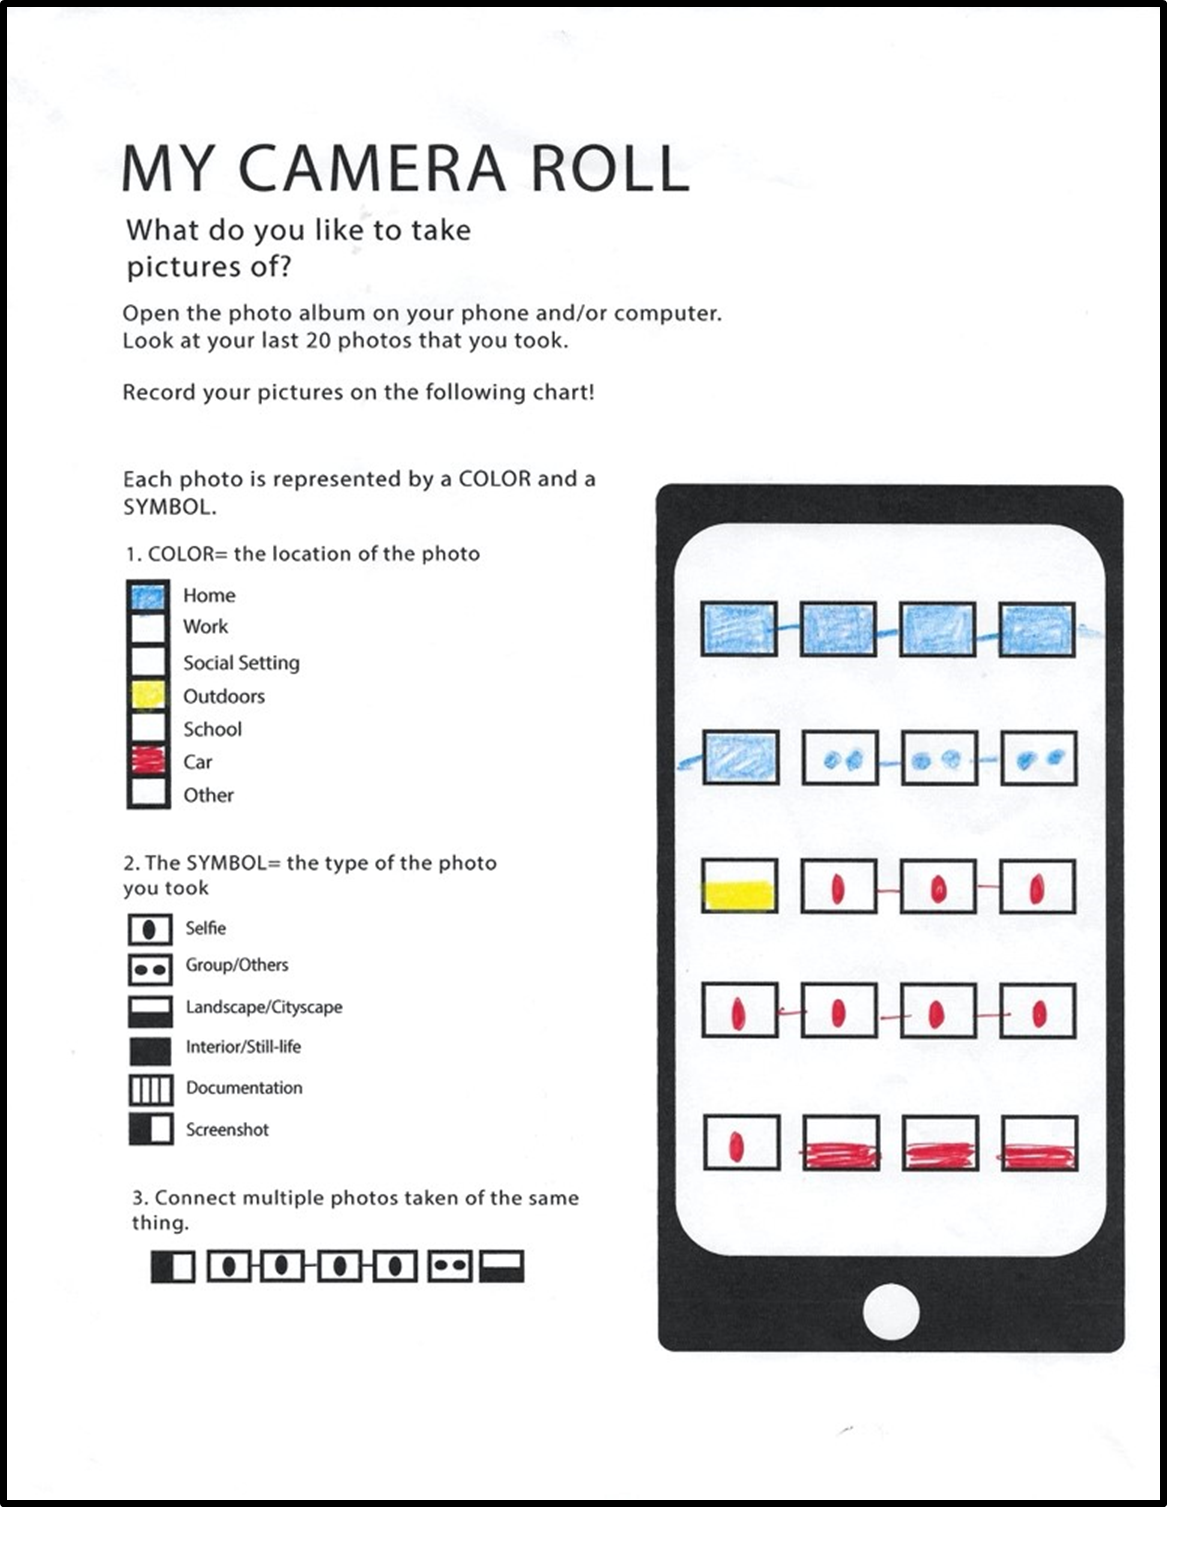
The third sheet doesn't require 3 days of data gathering. You can sit down with your phone or your computer and look at the last 20 photos you have. Preferably these will be photos you took. Each photo will fit into a category of where it was taken and also what type of photo it is. So, like you did with worries, you will have a color and a symbol representing each photo. Also, you can connect each photo with a small line between the rectangles if they are a photo of the same thing over and over. Here is an example:
Hopefully this will be eye opening for you and help you understand that the data you gather can then be used to improve our lives. We will be using this data in our homework that is due this week. So do a good job of gathering and recording your data.
- Download the three datasheets.
- Record your data for 3 Days. This data will be used for the Tabular Data assignment due at the end of the week.
Submission
This assignment has no deliverable, however the data gathered will be used in the Tabular Data assignment.
Useful Links:
- Next Activity: Data to Decisions
- Previous Activity: Understanding Data
- Go to: Week Index • Course Home • Canvas